
Last sunday, we talked about answer of the ‘what is overfitting?’ question. Today, we will talk about first solution of it -increasing data diversity and using more data.
Firstly, let’s talk about overfitting, again. This is when your machine learning model memorizes patterns in the data. After that, your model succeeds in predicting your training dataset, but fails on your test dataset.
Today, we will talk about a solution technique of it. If you did not read the first post, here you can see it.
So, let’s start. Right now, you are a data scientist in a Superstore –click here to see the dataset. Your job is creating a model that will predict ‘Sub-Category’ feature of the dataset.
And now, you have created your model. After testing it on your training dataset, you’ve got 100% accuracy. But your test dataset resulted with 56% of accuracy. Your model overfitted.
The time has come to add new different data. Below, you can see the last 6 columns and first 5 rows from the data.
| Sub-Category | Product Name | Sales | Quantity | Discount | Profit |
| Bookcases | Bush Somerset Collection Bookcase | 261.96 | 2 | 0 | 41.9136 |
| Chairs | Hon Deluxe Fabric Upholstered Stacking Chairs, Rounded Back | 731.94 | 3 | 0 | 219.582 |
| Labels | Self-Adhesive Address Labels for Typewriters by Universal | 14.62 | 2 | 0 | 6.8714 |
| Tables | Bretford CR4500 Series Slim Rectangular Table | 957.5775 | 5 | 0.45 | -0383.031 |
| Storage | Eldon Fold ‘N Roll Cart System | 22.368 | 2 | 0.2 | 2.5164 |
For instance, ‘Tables’ row came with approximately 958 sales, 5 quantity, 0.45 discount, and -0.383 profit. We need to add new ‘Tables’ row with different number of sales, quantity, discount, and profit. It will possibly solve the overfitting problem. You can see an example row like that:
| Sub-Category | Product Name | Sales | Quantity | Discount | Profit |
| Tables | Hon Racetrack Conference Tables | 787.53 | 3 | 0 | 165.3813 |
But generally adding only one row is not enough. You need to add more than one row. And you should give more examples for ‘Storage’, ‘Labels’, ‘Chairs’, ‘Bookcases’ rows.
Adding rows manual will be so hard for you. Here of this blog post, I will show you some hints for doing this with Generative AI.
What we will do is data augmentation. Data augmentation is a technique used in machine learning to increase the size and diversity of your training dataset by creating artificial variations of existing data. This is particularly helpful when your dataset is limited, as it can prevent overfitting and improve the generalization ability of your model.
At first, I will show you doing this on ChatGPT. You can see my prompt and answer below.
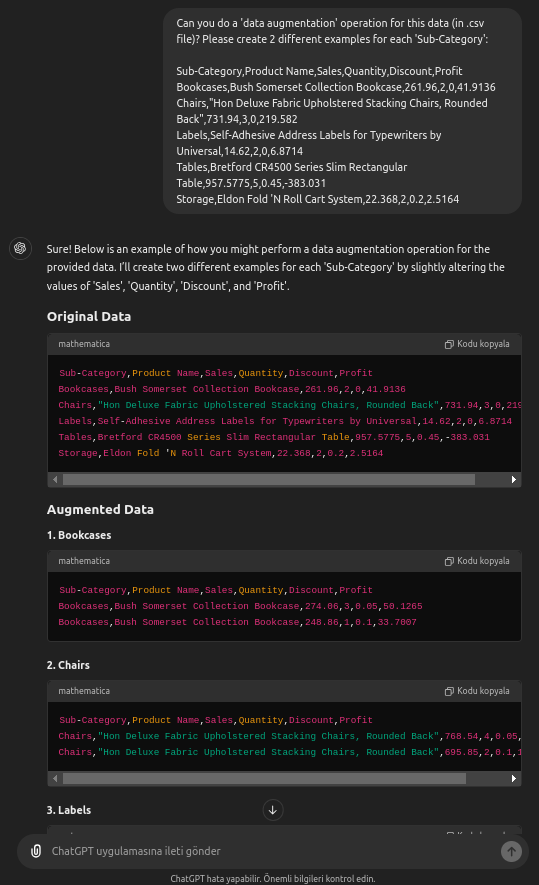
As you can see here, ChatGPT augmented our data with some new entries. You can add a sentence in your prompt like “…create 20 different examples for each Sub-Category’…”, it will give 20 more different data to you.
The key point here is that it can produce as many different data as we specify. Then we can add this data to our .csv file. Here, I will show you another tool that can augment your data easily. We will use an data augmantation tool called Mostly AI right now.

When you open that website, select ‘Get started free’ and create your account. Then, see the screen below.
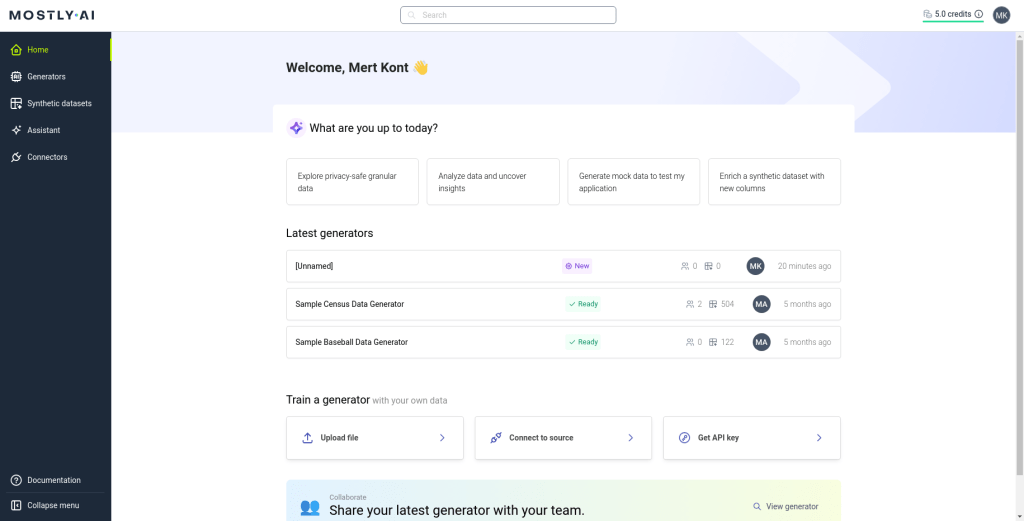
Here, select ‘Upload file’ from ‘Train a generator’ part of the website. Then, upload your dataset. Here, we will do it Superstore dataset. Then, select the ‘Generate data’ and then ‘Start generation’ buttons.
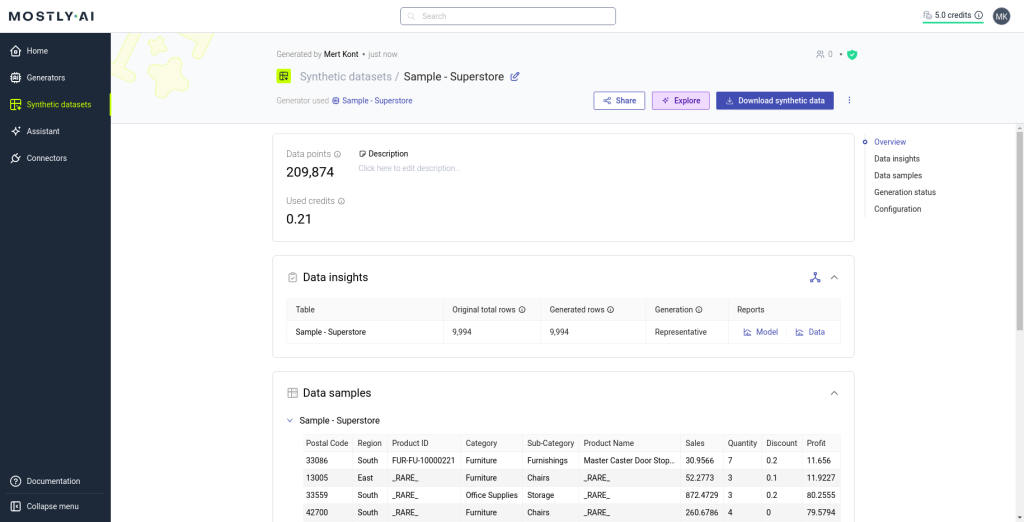
As you can see, our process finished with 209.874 new data. You can download your data from ‘Download synthetic data’ button. As you can see, it is too easy to augment your data with Mostly AI.
This brings us to the end of this part of our overfitting study. You can click here to return to the main article. Thanks for reading!

Leave a reply to worldphoto12 Cancel reply